Post-Covid Ripple Effects
Medicaid Ejections, Higher Cost-Sharing Are On Tap in 3, 2, 1...
In This Edition (we need a new word, suggestions please!):
Return to Pre-pandemic normal = bad news for some
COVID’s Effect on Insurance Premiums Not In The Price (yet)
More Free Quoting Access (it has always existed)
Public Health Emergency Ends
Hooray no masks required. But, now some assistance will end.
Medicaid will end for many (link)
Greater APTC is scheduled to end at the end of 2022 (link)
Build Back Better negotiation window opens (link)
Unemployment benefits ending, and people back to work (link)
If this is you or someone you know, there will be a Special Enrollment Period for individual health insurance for those that lose Medicaid.
What’s not in the news yet, but will be (about 99.9999% certainty): the public health emergency ends on April 16, and from that point, you can expect cost-sharing (copays, deductibles) to return to the consumer, and not be paid by the federal government or your insurance company.
COVID’s Effect On Insurance Pricing Has Still Not Appeared: For Now
Life expectancy dropped by over a full year in the US due to the pandemic. The question is whether it was a blip. If not, then the likelihood for the base case is to pass away sooner, making insurance prices…higher.
What Has Changed
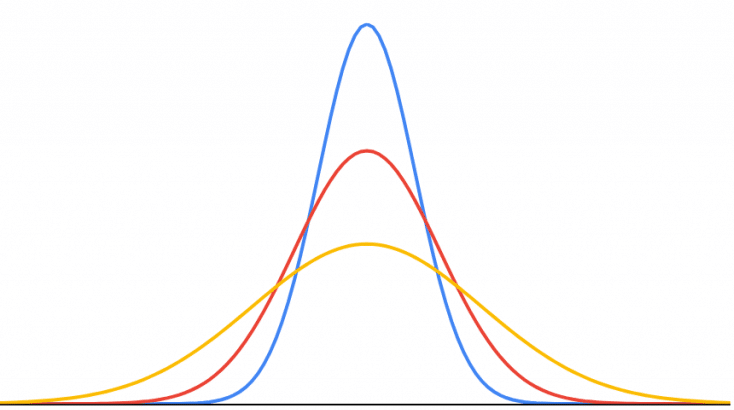
The average life expectancy has declined. That means the “high point” of all three graphs in image has shifted.
Importantly, the volatility (the number of scenarios and their frequency) has increased due to COVID. So the average is lower and we have moved from the blue line to the red or yellow line.
Life insurance Cash Flow Graph Should Look Awfully Familiar
C = price (premium) of the option, which is your life insurance premium, something that I am trying to communicate with you). Follow the pattern of the cash flows. If it looks like a duck, and graphs like a duck, it’s a duck.
Subscribe to the YT Channel (click here).
Online Quoting
The way to use this? Click around to the context/ball park. Then, double back to nail down the details. You can click on the image to go to the site.
Click on the image to get the ebook version (or click here). Paperback version in April, due to supply chain issues.
Social Security “Arbitrage”?
This is an excellent article. They compared the post-tax cash flows over alternatives, and actually measured the results. They didn’t just spew out their opinion, without evidence and actual data.
This has been my point, i.e. delaying Social Security can make sense, IF you have other sources of income. This is a very good example. The writers? Professors, and this research paper at the National Bureau of Economic Research (NBER).
Here’s a hint: it is very very unlikely that the findings at the NBER are completely wrong. I cannot say that about YouTube.
Here’s another hint: this is STILL limited, because it doesn’t take Medicare IRMAA or the APTC (subsidy for health insurance), at all.
You’ll get curated, the highest-quality perspectives as part of the Paid Subscriber version, for those that require. A single article / video will pay for the subscription fee, I am 100% convinced of this, it’s an easy conclusion for me to draw because I have personally directed someone to save/keep/earn 10x-100x.


